Get Certified for Financial Modeling (FMVA)®
Gain in-demand industry knowledge and hands-on practice that will help you stand out from the competition and become a world-class financial analyst.
Guide to unlevered beta (asset beta), how to calculate it, and what it's used for
Unlevered beta (a.k.a. Asset Beta) is the beta of a company without the impact of debt. It measures the systematic risk of a company’s assets relative to the market, independent of the company’s financial leverage. It compares the risk of an unlevered company to the risk of the market. It is also commonly referred to as “asset beta” because the volatility of a company without any leverage is the result of only its assets.
Levered beta (or “equity beta”) is a measurement that compares the volatility of returns of a company’s stock against those of the broader market. In other words, it’s a measure of risk, and it includes the impact of a company’s capital structure and leverage. Equity beta allows investors to gauge how sensitive a security might be to macro-market risks. For example, a company with a beta of 1.5 has returns that are 150% as volatile as the market it’s being compared to.
When you look up a company’s beta on Bloomberg, the default number you see is levered, reflecting the debt of that company. Since each company’s capital structure is different, an analyst will often want to look at how “risky” the company’s assets are, regardless of what percentage of debt or equity funding it has.
The higher a company’s debt or leverage, the more earnings from the company that is committed to servicing that debt. As a company adds more and more debt, its uncertainty of future earnings is also increasing. This increases the risk associated with the company’s stock, but it is not a result of the market or industry risk. Therefore, by removing the financial leverage (debt impact), the unlevered beta can capture the risk of only the company’s assets.
To determine the risk of a company without debt, we need to un-lever the beta (i.e., remove the debt impact).
To do this, look up the beta for a group of comparable companies within the same industry, un-lever each one, take the median of the set, and then re-lever it based on your company’s capital structure.
Finally, you can use this Levered Beta in the cost of equity calculation.
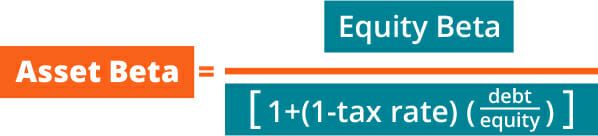
For your reference, the formulas for un-levering and re-levering Beta are below:
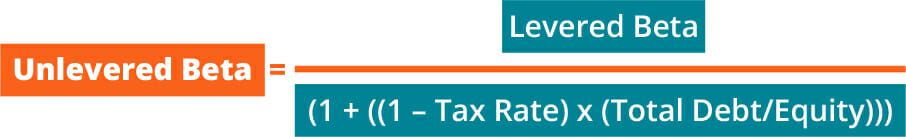
![]()
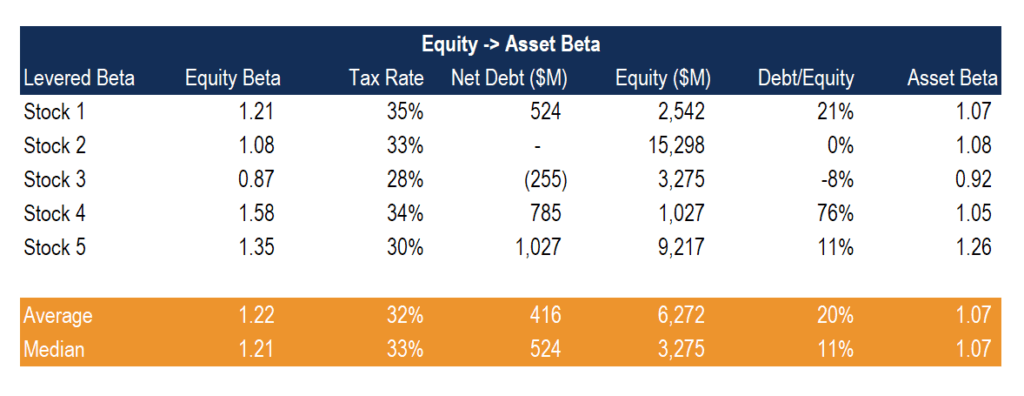
Below is an example analysis of how to switch between Equity and Asset Beta. Let’s analyze a few of the results to illustrate better how it works.
Stock 1 has an equity beta of 1.21 and a net debt to equity ratio of 21%. After unlevering the stock, the beta drops down to 1.07, which makes sense because the debt was adding leverage to the stock returns.
Stock 2 has no cash and no debt, so the equity and asset betas are the same. This makes perfect sense since there is no capital structure impact on the returns.
Stock 3 has a net cash position (negative net debt), so when it is converted, the asset beta is actually higher than the equity beta. This also makes sense because the value of cash never changes, so the volatility in the stock (equity beta) is actually lowered by the effect of the net cash position.
Click the button below to download CFI’s free Equity Beta and Asset Beta Conversion template!
Asset beta is used to measure the risk of a security minus the company’s debt.
It is best to use asset beta when either a company or an investor wants to measure a company’s performance in relation to the market without the impact of a company’s debt.
Compared to levered beta, the asset beta does not take into effect the impact of financial leverage (debt). Asset beta is commonly used in financial modeling and business valuation for professionals working in investment banking or equity research.
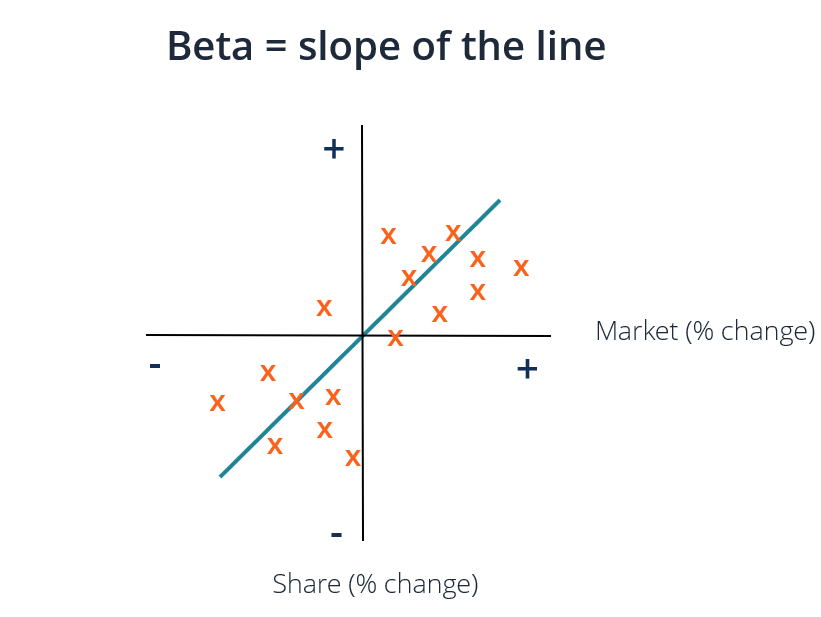
Beta is calculated as the line of best fit on a graph of market returns vs. the asset’s returns. In Excel, this can be calculated using the Slope function.
Connect what you just learned to a clear career path with CFI’s role‑based courses and certification programs.
Through financial modeling courses, training, and exercises, anyone in the world can become a great analyst. To keep advancing your career, the additional CFI resources below will be useful:


